Hi all, welcome back to our Movie Marathon trilogy, series of posts exploring IMDB movie industry data. Today it’s Episode 2 on the programme and don’t worry, unlike many other movie sequels this one won’t disappoint 🙂 In case you missed first part of the series, be sure to check it out, you’ll learn how we scraped the hell out of IMDB web page with the help of our robot friends.
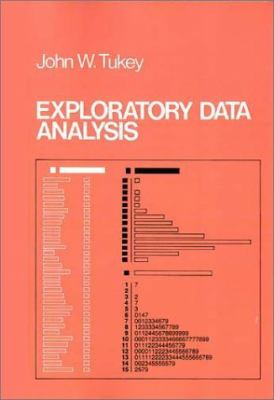
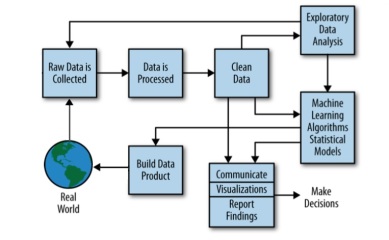
Now that we have the data it’s time to play, it’s time to start asking questions…but what is a good question to ask? Which hypothesis should we test? At this point in any data analytics project, after days or even weeks of painful data collecting and wrangling, people are impatient and eager to start digging for some big insights right away. Often they’ll go for the kill and start analysis with some meaning-of-life type of question/hypothesis to be tested (been there, done that). Other reason why data scientists very often start the investigation with the more complex problems is the love for the algorithms… because big problems require big guns – complex ML algorithms that they can develop or play with (been there as well). So in a hurry to get to the machine learning stage, data scientist sometimes overlook one crucial step in data analysis process and that is Exploratory Data Analysis or simply EDA… and this is particularly true for people coming to analytics world from programming/IT side (rather than business). But what is EDA? EDA is an approach to analyzing data that uses quantitative and visual methods to summarize and better understand data set in question. It is important step to take before starting with formal modeling because EDA helps you to validate quality of data, enables you to develop appropriate model for the problem in question and to correctly interpret its results afterwards.
Today new tools, open-source libraries and off-the-shelf implementations are making it easier than ever to get working ML algorithms up and running, so it’s tempting to take shortcut and just use plug-and-play approach, but this is a huge risk and very often first step to failure. EDA is low-hanging fruit that many organizations and data scientists fail to pick. It very often leads to new insights and it also provides natural introduction for more complex analytics projects; it engages business stakeholders, ensures they are asking right questions and provides for better alignment between business stakeholders and data scientists. In these days of ML/AI hype, many organizations are desperately trying to jump on the bandwagon and execute “big data” project that in the best case scenario offers doubtful ROI. In the same time, these same organizations fail to use and take advantage of basic BI tools at their disposal. It takes time to build data driven culture and progress on maturity scale, and it takes even longer if you skip EDA approach.
Anyway, enough with the EDA (hope you got the point), now it’s time to start asking questions. I was thinking about which tool to use; Python maybe, or Excel (scraped data is in .xlsx so it would be very fast to produce some pivots), but recently I got access to IBM’s Watson Analytics, so why not take it for a test drive. In short, Watson Analytics (WA) is self-service cloud-based BI & analytics tool that you can use to quickly discover patterns and meaning in your data. It offers guided data discovery, automated predictive analytics and cognitive capabilities such as natural language processing (NLP), so you can interact with data conversationally to get answers you understand. I must admit it’s a cool feature for (business) users that are not tech-savvy, but what we are primarily interested is data discovery and quick visualizations, basically we want to perform EDA. (Note: until mentioned otherwise data set under investigation comprises of english-language feature films from 1994 to 2017). So let’s start asking some questions…
For start, how many movies are being made per year?
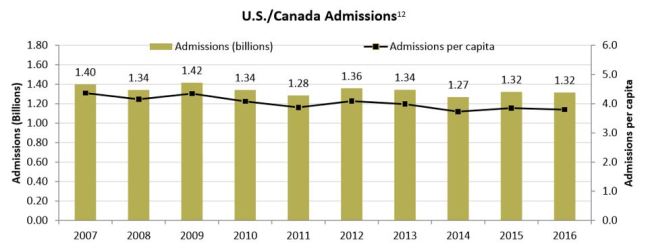
Wow, that’s a huge increase. Almost sixfold in less than 25 years, with CAGR around 8%. Very interesting… especially if we put it in perspective and compare it to let’s say global population growth which has yearly increase of about 1.2% and even less in the USA & Europe which are the movie industry primary markets. I googled and found US/Canada movie theater admission data and now it gets even more interesting, basically there is no increase in theater admissions compared to huge increase in the number of movies made. We’ll have to check whether this affects financial bottom line of the industry (but more about financial aspect in part 3 of the series).
Hmm, what next… what about movie distribution by genre? Before we go further, one important note, original “Genre” column wasn’t very useful as there were zillion combinations and it was very hard to manipulate with so we used one hot encoding procedure. So important thing to remember, e.g. Dunkirk (what a great movie!) is Action AND Drama AND History, which means it will be counted 3 times. Why am I mentioning this, if we want to calculate segmentation by genre the percentages will not stack to 100%, it will be more than 100%. So keep this in mind…

So back to the topic, segmentation by genre looks as following; Drama is by far most common movie genre, followed by Comedy in second place and Thriller/Horror joint third. To be honest, I wouldn’t have guessed that 45% and 28% of movies fall into Drama and Comedy category respectively, while Thrillers and Horrors have around 14% market share. (Note: as mentioned before percentages don’t stack to 100%, e.g. Get Out is both Horror and Thriller.)
But by looking at movie genres historical trends, things get more interesting; relative number of Action movies is falling from early 90s (yeah, golden age of American Ninja and other classics as mentioned in my previous post). Also, crime is falling, yeah, actual crime and number of Crime movies, as well as Comedy which saw huge decline from peak in 2003. with the drop of more than 10% since.
On the other hand, Drama movies increased their market share, as well as Horror movies that rose considerably from 2000. I’m even inclined to say that quality of Horror movies increased lately, but will wait to see what data has to say. Also, relative share of Romance movies declined considerably in the last few years, but can’t say it saddens me.
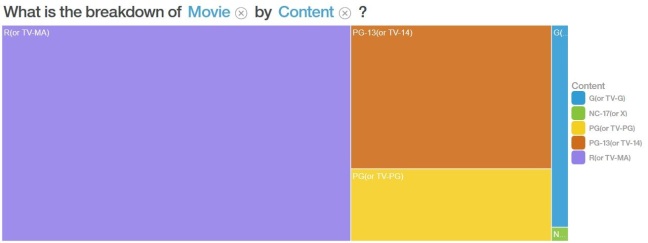
If we look at the distribution of movies based on Content Rating things are as follows: majority (around 60%) of movies fall into Restricted category (under 17 requires accompanying parent or adult guardian). More about Content Ratings find here and here.
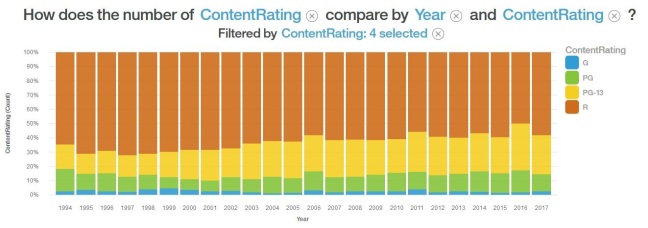
But what about trends, are MPAA “censors” becoming more strict? Well, not really. If we look at historical data R-rated movies are down from about 70% of market share to less than 60% in the last few years.
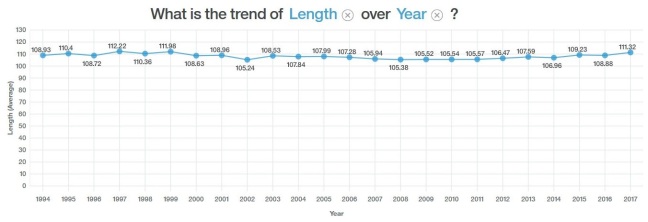
I have a feeling that movies are getting longer, what about that? Damn, I was convinced this was true, but data suggests otherwise. Interesting.
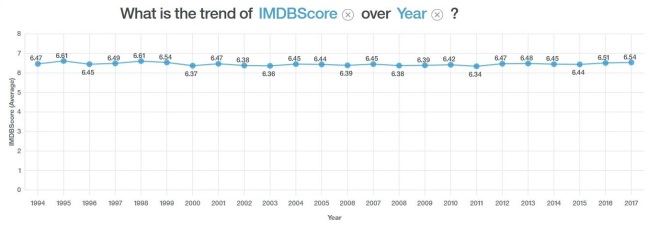
And what about movie quality? Surely movies are getting worse? Well, not exactly, trend of IMDB score over years is flat as a pancake. Interesting. But rest assured we’ll check quality of Academy Award nominees/winners as well 😉 Btw, for this analysis/visualization I’ve used only movies with more than 10.000 votes. Basically, this filters out movies that don’t have big enough sample of votes so that IMDB score could be considered relevant.
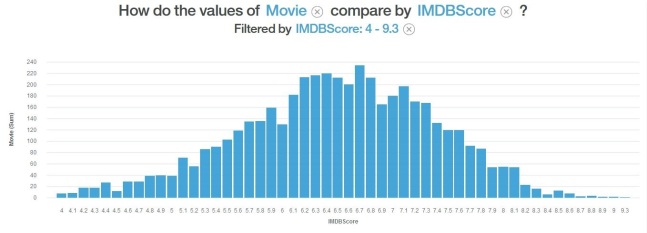
As we can see from the trend of IMBD scores over years, 6.4-6.5 is the average score and histogram of movies scores confirms this as well. On the far right, movies like The Shawshank Redemption, The Dark Knight, LOTR and Pulp Fiction, and on the far left,… God I don’t want to know. Btw, left tail is much fatter and longer, but I filtered it out in this picture.
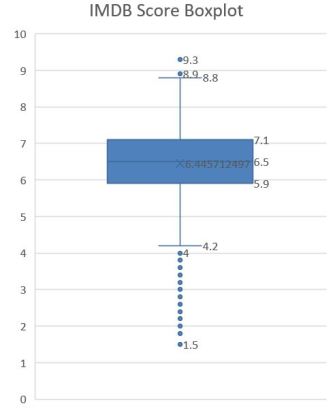
I’ve tried to visualize this through boxplot, but Watson lacks this visualization type (c’mon?!), so good old Excel to the rescue. Boxplots are great for capturing characteristics of the population distribution so if you forgot how to interpret boxplots check it out here.
Phew, this post has gotten very long very quickly so I think this is a good time to take a break, I don’t want to bore you to death 🙂 Quick post recap, we had short theoretical introduction about Exploratory Data Analysis (or EDA) after which we’ve shown you how that looks in practice. It’s extremely important to get the sense of the data, it might slow you down in the beginning, but it really pays dividend in the long run. As you can see from this exercise, by simple EDA approach we got some answers and insights, and these answers produced even more questions. We barely scratched the surface and yet things are already getting interesting, so many fascinating directions of investigation are presenting itself. (Did something crossed your mind as well?). It looks like this will be marathon indeed and who knows where the data will take us so stay tuned! 😉


